Measuring the impact of marketing activities in academic libraries

The question of measuring the impact of marketing efforts is a fraught one, even in the business world. Check out what Farris et al. have to say on the subject from Marketing Metrics: The Definitive Guide to Measuring Marketing Performance (2nd ed, Pearson Prentice Hall, 2010):

In business and economics, many metrics are complex and difficult to master. Some are highly specialized and best suited to specific analyses. Many require data that may be approximate, incomplete, or unavailable.

Little wonder then that many libraries don’t tackle it – in the US, one study found that less than 33% of academic libraries evaluated their promotional campaigns.

Farris et al. offer this:

Under these circumstances, no single metric is likely to be perfect. For this reason, we recommend that marketers use a portfolio or “dashboard” of metrics. By doing so, they can view market dynamics from various perspectives and arrive at “triangulated” strategies and solutions. Additionally, with multiple metrics, marketers can use each as a check on the others. In this way, they can maximize the accuracy of their knowledge … Being able to “crunch the numbers” is vital to success in marketing. Knowing which numbers to crunch, however, is a skill that develops over time. Toward that end, managers must practice the use of metrics and learn from their mistakes.

Brian Mathews in Marketing today’s academic library: a bold approach to communicating with students (American Library Association, 2009) offers up some of the potential components of that dashboard:

Response-based advertising
For instance getting a customer to visit a website, or take advantage of an offer. The website could be a campaign-specific secondary page to better track statistics.

Market share
This could be calculated by counting the total number of users and dividing them by the total student population. For instance if 4000 students checked out a book at least once during the year out of a total student population of 10,000 then the market share would be 40%. And then we might think about the other 60% who didn’t borrow anything and how to reach them.

How did you hear about us?
This involves inviting students to share their experience. This can be done face to face or by using a follow-up email.

Web analytics
Analyse total hit rates and click-through rates to your website via tools such as Google Analytics.

LibQual+
A customer service survey administered by the Association for Research Libraries (charges apply).

Recall
A technique that can be used in focus groups, surveys or one-to-one interviews.

Dorm (hostel) surveys

Longitudinal studies
This involves tracking student usage over time – how do they find out about our services and how do they use the library over time? Mathews’ example involves selecting 6 new students each year, who he meets with once a semester throughout their degree. He notes this isn’t scientific but it allows him to get a feel for selected user groups and to learn about their experiences.

As Mathew’s says, ultimately there is no silver bullet when it comes to measuring impact and as Farris et al. suggest we need a range of metrics. Critically we also need to remember that this is part of a bigger task – we need to figure out what success would look like – which is all part of the goals we set as to what we want our marketing activities to achieve – right back at the start of the cycle of our marketing activities. For Mathews:

… success, from a marketing standpoint, is a combination of familiarity along with usage, across the span of a student’s tenure. The longevity of library use from day one until graduation is what matters

and

I feel instead of simply focusing on generating awareness or even just increasing use of resources, we should approach communication more philosophically by viewing our marketing as a chance to elevate the role of the library in our students’ minds. In this manner, our advertising encourages them to expect more from us. We are not just providing more books, more journals, more computers, or more staff to help them, but rather more relevance. We should aspire to smash their preconceptions of what a library is and instead demonstrate what it can become.

He proposes the following:

1. List all of the library products and services that are relevant to undergraduates
2. At the end of the academic year ask a random sample of thirty students from different classes and ask them to
a) tick the products and services they have heard of and
b) tick those that they have actually used.

This allows you to track the effectiveness of your communications and the usage of your library.

What tools do you use to measure the impact of your marketing activities?
Article: Working with campus marketing classes to improve reference visibility

This article* describes how a library worked with marketing classes at Illinois Wesleyan University (IWU) to improve students’ interest in using reference services. This gave the opportunity for students to engage in a real-world problem, while meeting the academic needs of the course and providing the library with ideas as to how they could improve the visibility and usefulness of the service. Some key points from the article for me were:

  • the Library only specified two questions, the students generated the bulk of the survey questions
  • the survey results confirmed that the students love the library facility but fail to use its resources, specifically the reference desk to the fullest
  • students tended to be technology savvy, time poor, and unwilling to ask for assistance
  • students used Google as their main resource, and would ask peers and lecturers for help, but were unlikely to ask librarians
  •  the words “reference” and “information” were meaningless to students

Students provided recommendations for improving reference services, which were then considered by the librarians. As a result of this project:

  • a secondary sign was added to the “Information desk” sign – a large yellow “help” button
  • an instant messaging (IM) service was initiated (apparently marketing students “strongly advocated” this – Meebo was eventually chosen)
  • promotional materials were developed for the IM service and for the email reference service
  • walk-in workshops on specific topics were suggested by students, but were not pursued as they had failed to attract student interest in the past. As an alternative the library did decide to work on relationships with student groups – a “handful” of these scheduled time on sessions to improve research skills
  • the seating arrangements of the student assistant/librarian at the reference desk was reversed, with the librarian taking the front and center seat and the student assistant moving to the back

The article notes that the number of reference transactions jumped as a result of the changes, but overall “aggregate numbers continued to trend downward, though less dramatically”.

A second round of marketing class/library collaboration was undertaken with students developing marketing plans for the library. Ultimately this was considered less useful than the original collaboration as “the suggestions did not fit for the image that we wanted to portray and were not as appropriate for the real world as they seemed on paper”.  Of the suggestions that did fit, one was the adoption of a  standardised visual identifier (which eventually replaced the help button), that was used in a consistent manner across the website, on handouts etc. This identifier – the “AskeAmes” logo was created by a graphic design student.

I’m wondering now if there would be scope for something like this at the university I work at. I’d be very interested to hear if anyone else has undertaken similar collaborations.

Spotted on the M Word – Marketing Libraries blog

* Duke, L. M., & MacDonald, J. B. (2009). Working with campus marketing classes to improve reference service visibility. Marketing Library Services, 23(6). Retrieved from http://www.infotoday.com/mls/nov09/Duke_MacDonald.shtml

(Very) useful stuff about surveys

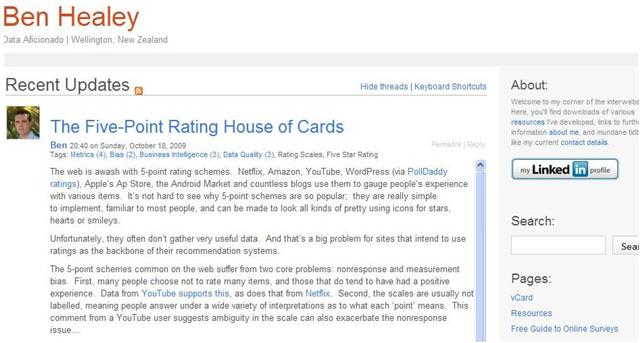
If you are involved in commissioning or putting together surveys them you can find some useful info over on Ben Healey’s blog including:

I did one of Ben’s papers at Massey University last year, before he escaped out into the real world (which was very bad luck for Massey marketing students IMHO! 🙂 ).

Bens blog


Surveys: Getting better return rates through incentives

One of the great things about working at a university library is you can get to along to lunchtime lectures on Wednesdays to hear academics talking about their research. The Dept of Communication, Journalism and Marketing here at the Turitea campus of Massey University has been running an excellent series of talks this year. This week Dr Mike Brennan spoke about “Doing research on the cheap”.

Mike spoke about using surveys to conduct experimental studies on how to improve return rates (this was for mail surveys). One of the key ways to improve return rates is to use an incentive, but what works best? As part of this experiment surveys had 20 cents, 50 cents, or $1 attached to them, or a chance to go into the draw for $200 or a $200 voucher, and there was a control with no incentive.

Return rates are improved by providing the incentive with the survey, rather than the promise of a prize draw or voucher. Turns out the 50 cent incentive got the best return from the first mail out in this experiment:


Mail 1

Mail 2

Mail 3

Control

24.7

46.6

57.5

20c mailout 1

27.1

43.5

54.1

50c mailout 1

46.0

66.7

74.7

$1 mailout 1

42.3

59.2

69.0

20c mailout 2

28.9

51.8

63.9

50c mailout 2

15.7

39.8

54.2

$1 mailout 2

23.5

51.9

69.1

$200 prize draw

25.6

43.6

57.7

$200 voucher

18.3

46.3

61.0

(NB We didn’t get a date that this research was done. Many thanks to my colleague Jane Brooker for noting the figures for this table.)

Obviously a small cash incentive is not true compensation for someone’s time, so wording such as “please accept this as a token of our appreciation” in the covering letter works well.

These days NZ Post doesn’t allow cash to be sent through the mail. Intrepid researchers have tried alternatives to cash in postal surveys. These include:

  • Pens
  • Tea bags, coffee bags, or both
  • Scratch and win cards
  • Stamps
  • Golf balls (!)
  • Turkeys (presumably vouchers for them!)

                                        choc2                                                                                                                                                                                                         Gold foil wrapped chocolate coins have also been tried, but a better option is the chocolate squares from Whittakers. Judging by the murmurs of approval from the audience this is likely to be a great incentive!


The other important thing is not to use just one mail out, but to send a reminder or another copy of the questionnaire in subsequent mailouts. As the table above shows this will increase response rates. Various combinations have been trialled and the 3 stage combo of questionnaire with chocolate/replacement questionnaire/follow up letter was mentioned as being successful.

Other external treatments have also been researched – these include using stamped v franked envelopes, brown v white envelopes, tone of the cover letter, status of the researcher (professor v student), colour of the questionnaire. Mike’s profile page details the research he and colleagues have published in this area.

PS –  I see there was a session at the recent LIANZA conference on designing effective surveys by Rachel Esson from Victoria University of Wellington, so that’s one conference paper I’ll be looking out for.

Research: Txt reminders increase voter turnout in New Zealand

Some interesting research on how text message reminders helped increase voter turnout in last year’s general elections:

In a controlled experiment on New Zealand’s parliamentary election day in 2008 those who received a txt (SMS) message from the “orange elections guy” reminding them to vote had a 4.7% point higher turnout than those who did not receive the txt message. This level of impact is large for a direct marketing initiative of its type and for a turnout differential between matched cohorts and indicates an effective and cost efficient way of prompting people to vote. Assuming the txt recipients were younger and more likely to be first time voters due to the general profile of txt users, large-scale adoption of this intervention could be particularly effective at motivating a priority audience for the Electoral Commission (and election management bodies (EMBs) internationally).

It made me wonder how many libraries offer text notices for reserves, overdues etc?  Does yours? (mine doesn’t …)

Survey of NZ school children – preliminary results

The Dominon Post reported on the first findings from this survey on Saturday. (Interesting that they are releasing results before the survey is even finished? Maybe its to get more publicity about it?)

The survey is:

Organised by Auckland University, the Education Ministry and Statistics New Zealand, the project aims to raise pupils’ interest in maths and statistics and provide a sketch of what they are thinking, feeling and doing.

Great! Any library questions in there I wonder? (If there aren’t can we get any added :-))

Interesting things so far:

* 88 per cent of children use a social network website

* 85 per cent of boys have a game console at home.

* 77 per cent of girls own an mp3 music player.

* 50 per cent of children download or listen to music online.